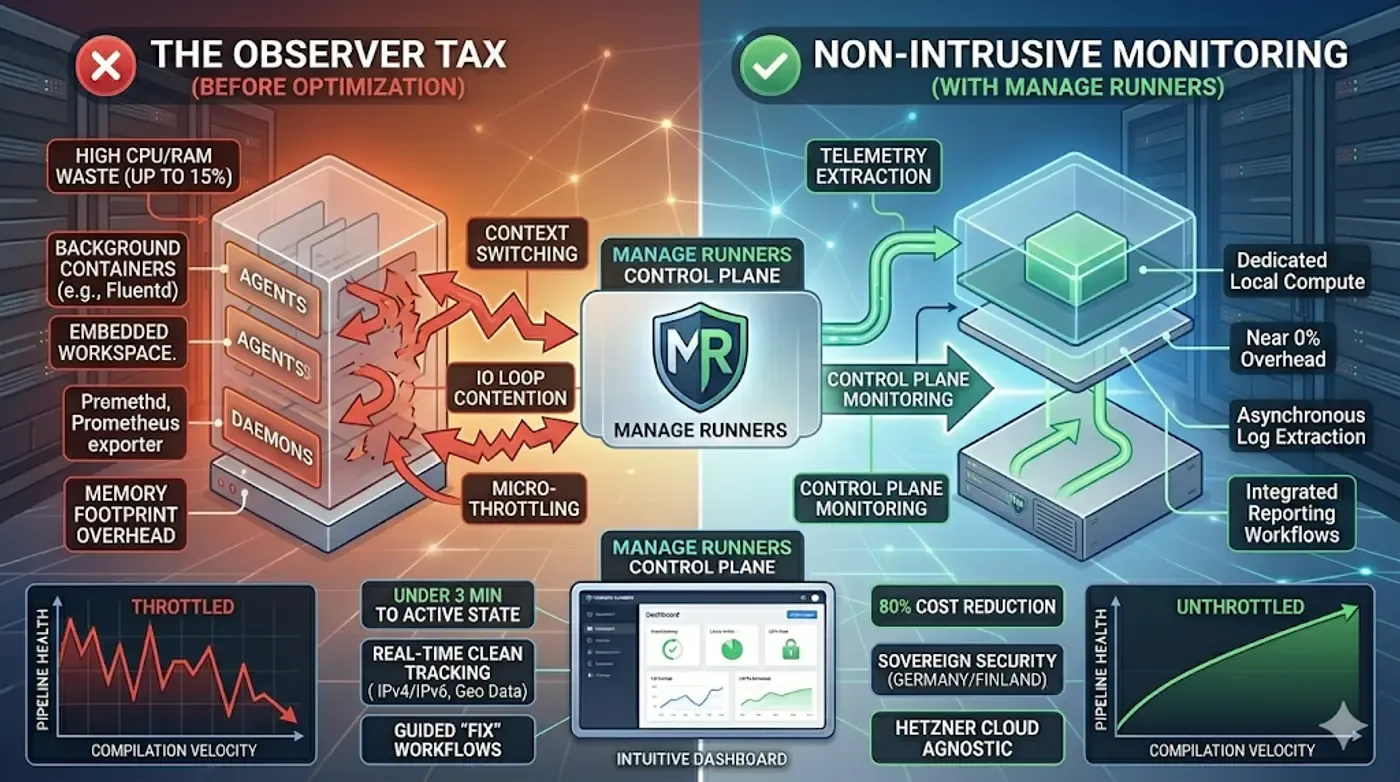
In the drive for total system visibility, modern DevOps architectures have inadvertently introduced a silent performance tax. While real-time log ingestion and infrastructure metrics are essential for pipeline health, the traditional method of gathering this telemetry data relies on heavy user-space background agents. In resource-constrained or highly concurrent compilation environments, these active scraping daemons can consume up to 15% of a build's processing power, transforming your monitoring framework into a critical pipeline bottleneck.
1. The Observer Effect in Continuous Integration
In physics, the observer effect dictates that the act of monitoring a system inevitably alters its state. In continuous integration, running traditional resource-intensive monitoring agents (such as Prometheus node-exporters, Fluentd daemons, or custom log forwarders) side-by-side with heavy compilation workloads causes a similar issue.
When a compiler attempts to parallelize a build across all available virtual cores, background processes frequently contest the CPU scheduler. This competitive execution forces the CPU to constantly swap cache lines and execution contexts between your compilation tasks and your logging tools, leading to micro-throttling.
2. Why Traditional Logging Agents Drain Compute
The 15% performance drop caused by background collection tools stems from fundamental architectural inefficiencies:
- Frequent Context Switching: Telemetry daemons continuously wake up to poll kernel metrics, interrupting high-throughput compilation loops.
- I/O Loop Contention: Both compilers and logging agents aggressively write to disk. Background utilities that read, parse, and structure raw logs in real time compete for the same NVMe storage bandwidth.
- Memory Footprint Overhead: Running JVM-based or unoptimized user-space agents inside a build container limits the RAM available for intensive test suites.
3. Shifting to Non-Intrusive Monitoring
To protect engineering velocity, platform engineers must transition to a model of non-intrusive monitoring. This framework isolates the telemetry extraction layer away from the primary execution thread.
Instead of embedding heavy collectors directly into the runtime workspace, an optimized pipeline abstracts telemetry tracking to an out-of-band control plane or hypervisor layer. This ensures that the build engine remains entirely focused on running the job code, while log extraction occurs asynchronously.
# Performance Blueprint: Decoupling Active Log Parsing
# Stream raw text directly to standard outputs rather than running
# heavy, active user-space log-parsing utilities inside the build job context
compile_optimized_job:
  stage: build
  script:
    - make parallel_compile > build_output.log 2>&1
  artifacts:
    paths:
      - build_output.log
4. Manage Runners: High-Velocity, Lightweight Fleet Automation
Manually decoupling telemetry infrastructure while maintaining clear line-of-sight on fleet health presents severe operational challenges. Manage Runners provides an elegant control plane designed to deliver maximum pipeline velocity and clear metric tracking for GitLab Runners on Hetzner Cloud without the architectural bloat.
By shifting your workloads to our streamlined infrastructure management layer, you eliminate the resource drains of traditional configurations:
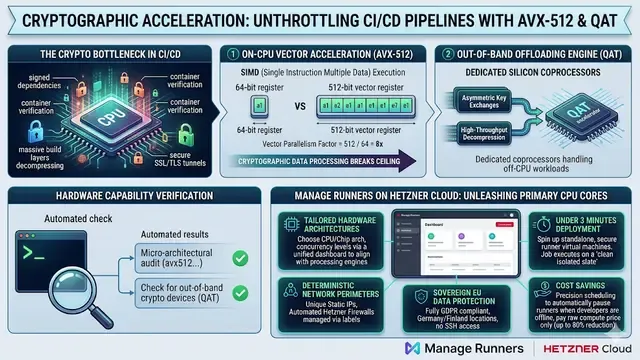
- Under 3 Minutes to Active State: Spin up pristine, standalone runner instances dynamically tailored with custom execution specifications (Docker, Docker-In-Docker, or Shell).
- Real-Time Clean Tracking: Monitor runner performance, connectivity metrics (IPv4/IPv6), and geographic data instantly via our glassmorphism-inspired UI without installing resource-heavy user-space daemons inside your build VMs.
- Integrated Reporting & Workflows: Catch infrastructure bugs early with native real-time error reporting and guided workflows to fix deployment issues like GitLab token validation failures immediately.
- Uncompromised Data Security: Built to be completely GDPR compliant. Your runners reside inside your own secure Hetzner account (Germany/Finland). For total source-code isolation, Manage Runners maintains no SSH access to your runner instances.
| Telemetry Strategy | Embedded Background Agents | Non-Intrusive Control with Manage Runners |
|---|---|---|
| Compute Overhead | Up to 15% CPU/RAM Waste | Near 0% (Dedicated Local Compute) |
| Workspace Safety | Shared host vulnerability | Isolated Hetzner Firewalls via Labels |
| Fleet Scaling | High manual configuration toil | Instant 1-Click Duplication |
| Cost Profile | Marked-up managed pricing | Up to 80% Cost Reduction via Schedules |
5. Conclusion
Pumping real-time analytics out of your infrastructure shouldn't force you to sacrifice execution speed. Moving away from heavy internal monitoring daemons to a streamlined architecture allows you to protect your processing cores and scale your pipelines efficiently.
Ready to reclaim your processing power? [Optimize your Telemetry Data with Manage Runners] and unlock clean, unthrottled performance on Hetzner Cloud.